

Pinpoint helped reduce Loss Ratio by 4 points on personal auto
Client: National Auto Carrier
Line of Business: Auto Insurance
Number of Policies: 714,577
Average Premium: $2,495
Use Case Focus: Customer Acquisition
Challenges for Auto Insurers: The combined ratio for personal auto has worsened from 92.5% in 2020 (the best result in 25 years) to more than 102.7% in 2022. Auto insurers are feeling the pressures with growth in personal auto insurance premiums remaining relatively flat, despite significant increases in vehicle part replacement and repair costs. Discover how this auto insurer partnered with Pinpoint to optimize their marketing spend using one of our loss cost models.

Results
ROI Calculator Results
The carrier’s year-one loss ratio impact using Pinpoint’s prediction estimated a 3.57 points loss ratio improvement with a total loss ratio improvement of 8.36 points after the third year.
The client saw a 1st-year ROI of over $40M and a total 3-year ROI of over $218M for their carrier’s auto-book of business using Pinpoint Loss Predictions.
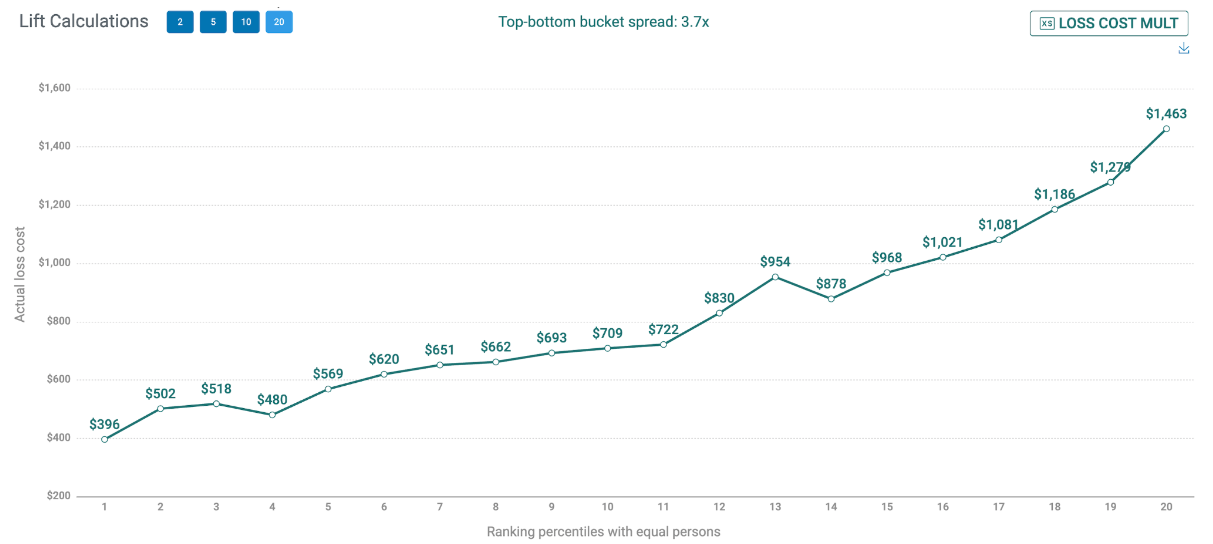
Our ROI calculator incorporates the predictive model’s lift by decile to project how new insights can prioritize actions to align with the carrier’s goals of profitable growth.

Why Work with Pinpoint?
Pinpoint’s lift chart allows the carrier to identify drivers with an exceptionally high loss ratio for whom they do not have an adequate rate. This early prediction, available as soon as they have someone’s name and address, helps the carrier flag an alternate application journey for that potential insured. Pinpoint’s Loss Predictions can help unlock a new source of intelligence for auto carriers to fast-track their profitable growth.